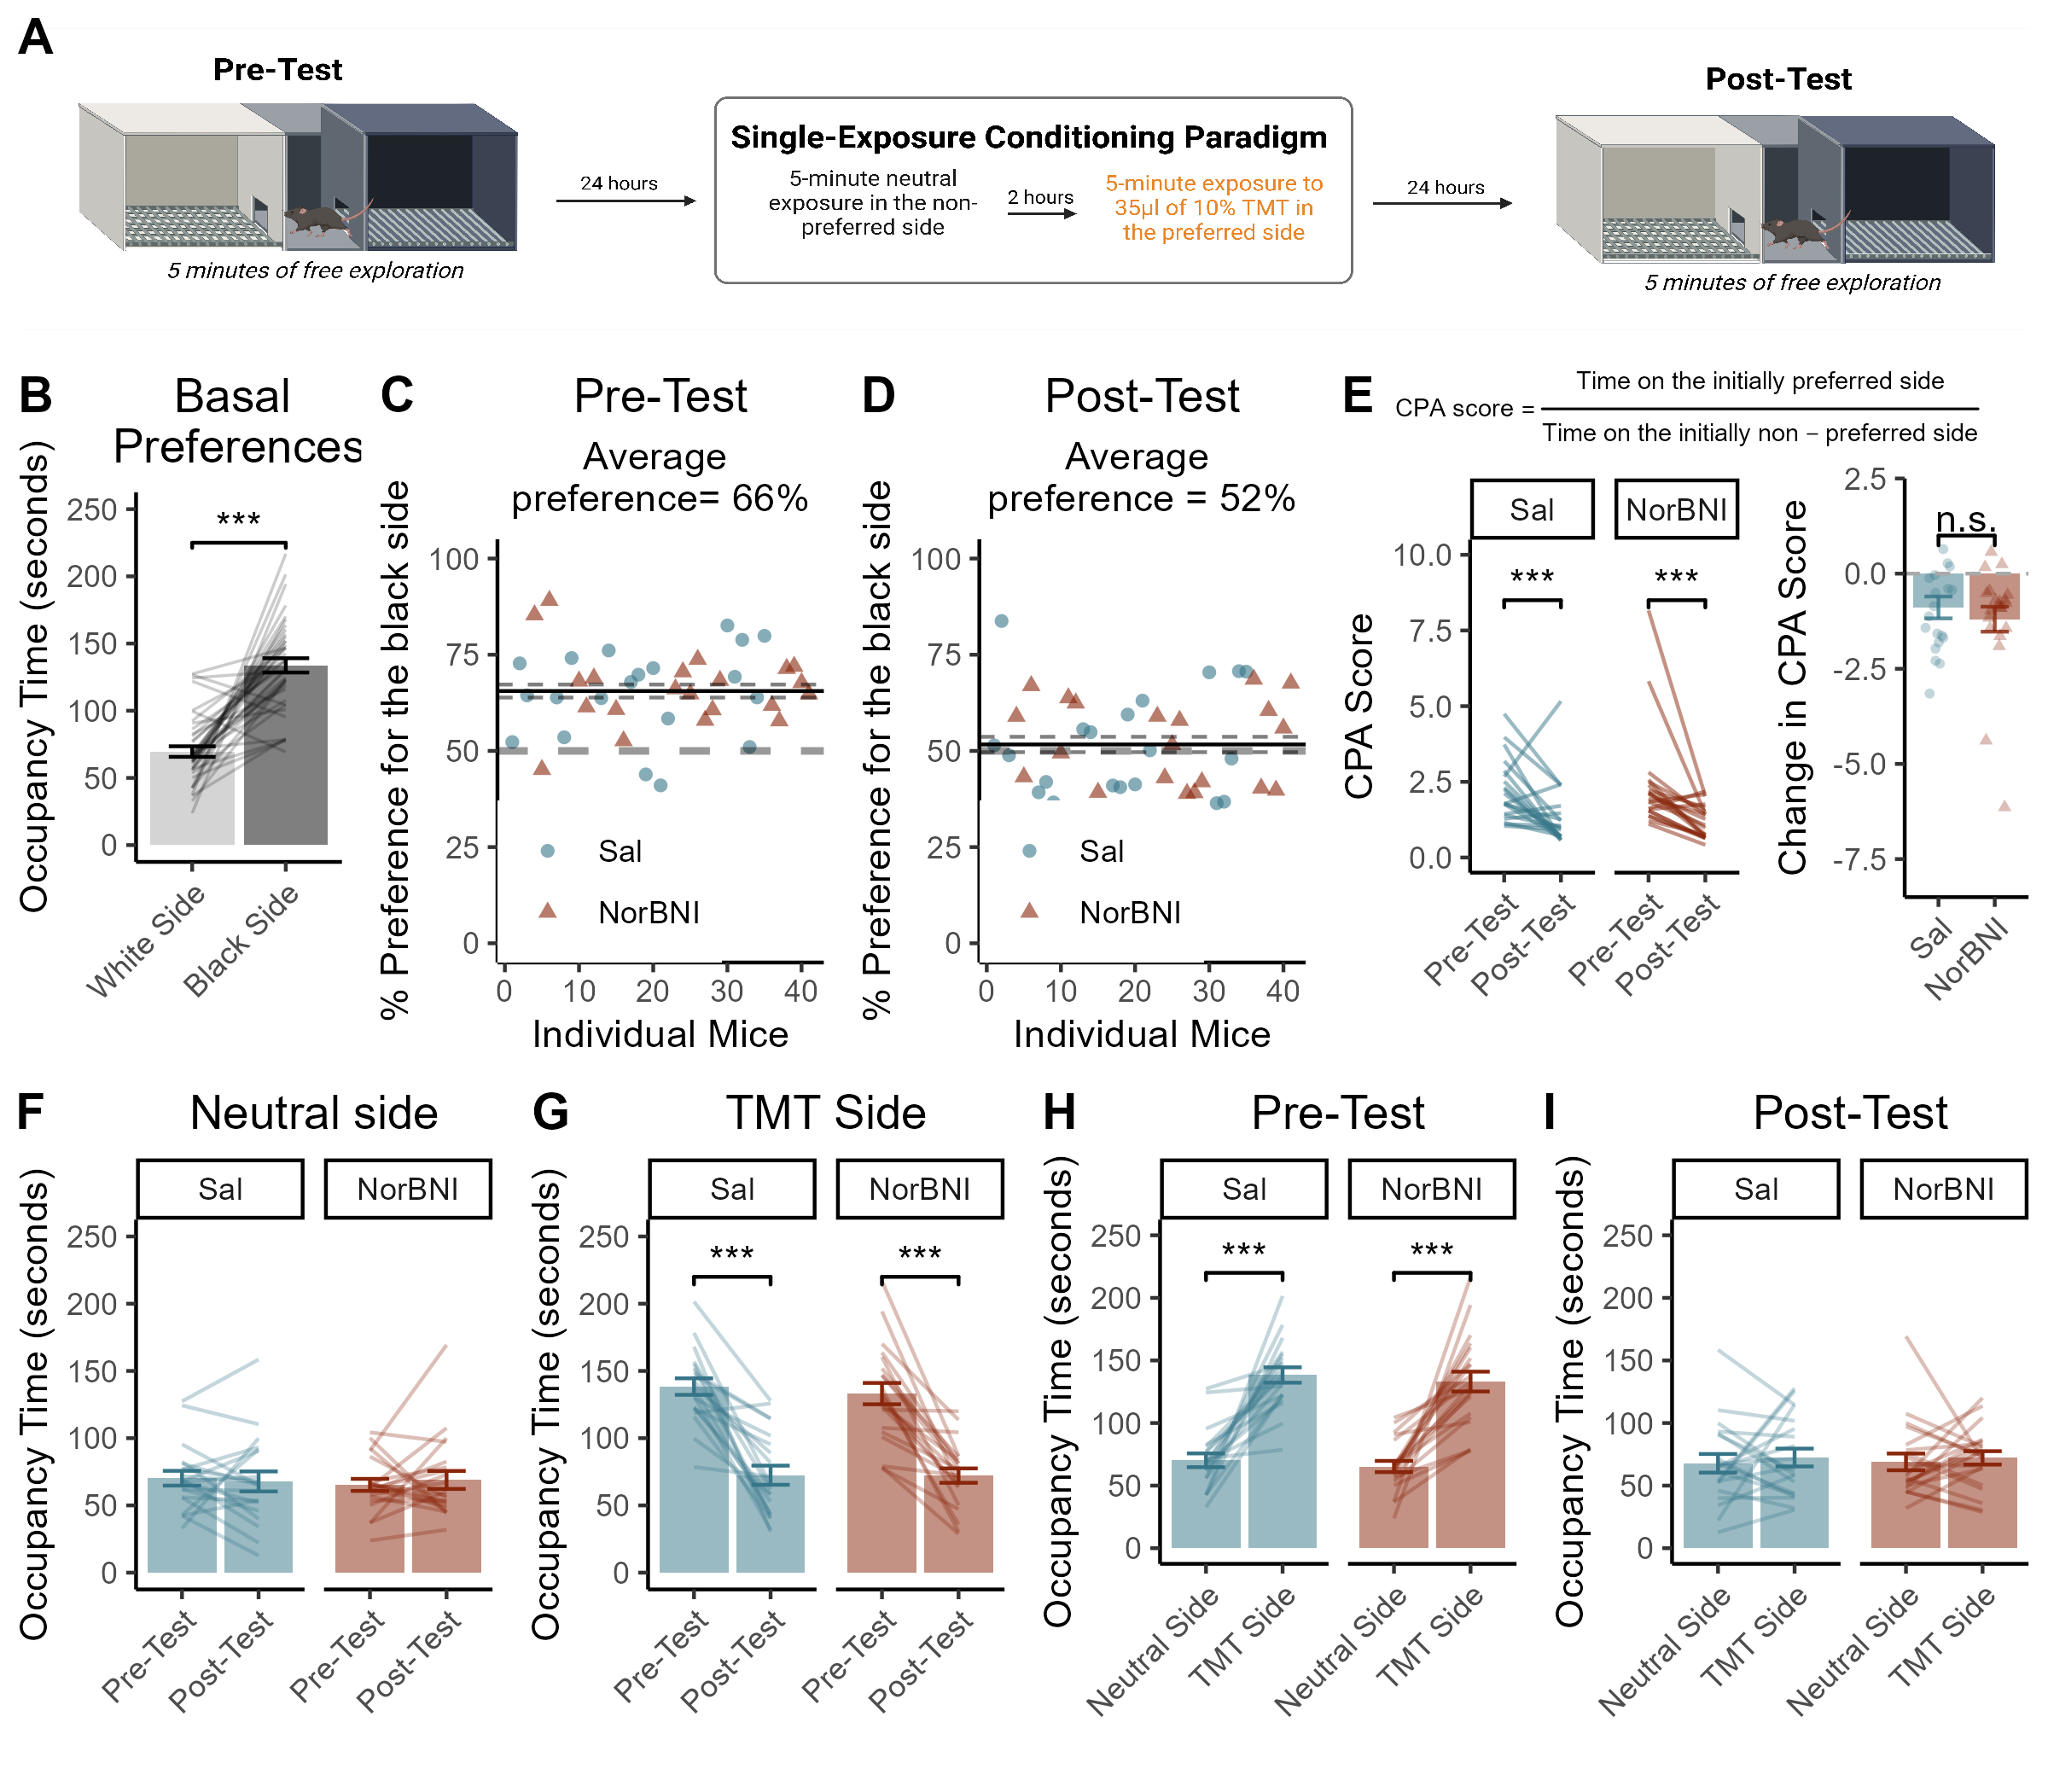
Figure 3 Conditioned Place Aversion to TMT

Figure 3.1: Timeline of experimental proceedings for Conditioned Place Aversion (A). The Conditioning apparatus used in these epxeriments was biased, such that mice exhibit an overall preference for the black compartment over the white compartment under basal conditions (B,C). The preference for the black compartment was reduced after the training session with TMT (D). Mice exhibited conditioned place aversion between the pre-test and the post-test (E) Which was not altered by NorBNI (F). Between the pre-test and the post-test, mice reduced time spent on the TMT-paried side (G) but did not exhibit a change in time spent on the netutral side (H). The strong side preferences that were observed during the Pre-test (I) were ablated by the single paring with TMT (J). Data presented as mean value +/- SEM, *** indicates p < 0.001.
3.1 Statistical Analyses
We conducted an initial preference test to evaluate each mouse’s preferred side of the CPP apparatus. Time spent in each of the 3 compartments was scored manually. We found that overall, mice preferred the black side of the apparatus over the white side (paired t(40) = 8.53, p < 0.001).
##
##  Paired t-test
##
## data:  BL_black_time and BL_white_time
## t = 8.5259, df = 40, p-value = 1.553e-10
## alternative hypothesis: true mean difference is not equal to 0
## 95 percent confidence interval:
##  48.93262 79.33958
## sample estimates:
## mean difference
##         64.1361
Indeed, 38 / 41 mice tested in these experiments spent more time on the black side of the apparatus than the white side during the baseline test. Each mouse was exposed to TMT on the side that it exhibited a preference for during the baseline test (i.e. 38 of 41 mice were exposed to TMT on the black side of the apparatus).
but did not exhibit a change in time spent in the neutral (non-preferred) compartment (p = 0.88).
##
##  Paired t-test
##
## data:  Baseline_tm_NON_PREF and Post_tm_NON_PREF
## t = -0.15062, df = 40, p-value = 0.881
## alternative hypothesis: true mean difference is not equal to 0
## 95 percent confidence interval:
##  -10.352845   8.916748
## sample estimates:
## mean difference
##      -0.7180488
To investigate chagnes in occupancy time between the Pre-test and the Post-test, computed a 3-way mixed model ANOVA with Task (pre-test or post-test) and Side (preferred or non-preferred) entered as the within-subjects variables, and Drug condition (Sailne or NorBNI) entered as a between-groups factor. The model indicated a significant Task * Side interaction (F(1,39) = 76.52, p < 0.001).
| Effect | DFn | DFd | F | p | p<.05 | ges |
|---|---|---|---|---|---|---|
| Drug | 1 | 39 | 0.214 | 0.646 | 2.00e-03 | |
| Task | 1 | 39 | 59.793 | 0.000 | * | 2.35e-01 |
| Side | 1 | 39 | 48.177 | 0.000 | * | 2.87e-01 |
| Drug:Task | 1 | 39 | 0.461 | 0.501 | 2.00e-03 | |
| Drug:Side | 1 | 39 | 0.007 | 0.936 | 5.44e-05 | |
| Task:Side | 1 | 39 | 76.520 | 0.000 | * | 2.42e-01 |
| Drug:Task:Side | 1 | 39 | 0.006 | 0.939 | 2.50e-05 |
Follow-up analyses of the significant interaction indicated that mice exhibited robust preferences during the baseline session (t(41) = 10.27, p < 0.001) and that the preferences were not present during the post-test session (p = 0.51). Moreover, Mice decreased the amount of time spent on the initially prefrred side of the apparatus between the pre-test and the post-test (t(41) = 10.57, p < 0.001) but there was no change in occupancy time on the non-preferred side between the two sessions (p = 0.88). The 3-way interaction between Drug, Task and Side was non-significant (p = 0.94), indicating that kappa opioid antagonism did not alter the induction or the expression of conditioned place aversion to TMT in female mice.
| Task | .y. | group1 | group2 | n1 | n2 | statistic | df | p | p.adj | p.adj.signif |
|---|---|---|---|---|---|---|---|---|---|---|
| Post | value | Preferred | Non-Preferred | 41 | 41 | 0.6629701 | 40 | 0.511 | 0.511 | ns |
| Pre | value | Preferred | Non-Preferred | 41 | 41 | 10.2746859 | 40 | 0.000 | 0.000 | **** |
| Side | .y. | group1 | group2 | n1 | n2 | statistic | df | p | p.adj | p.adj.signif |
|---|---|---|---|---|---|---|---|---|---|---|
| Preferred | value | Post | Pre | 41 | 41 | -10.5721883 | 40 | 0.000 | 0.000 | **** |
| Non-Preferred | value | Post | Pre | 41 | 41 | 0.1506239 | 40 | 0.881 | 0.881 | ns |
We also computed “CPA Scores” which represent the ratio of time on the preferred side to the non-preferred side:
\[CPA \; score = \frac{time \;on \;the \;preferred \;side}{time \;on \;the \;non-preferred \;side}\]
We found a significant effect of timepoint on CPA scores such that the ratio decreased between the pre-test and the post-test (F(1,39) = 22.67, p < 0.001)
| Effect | DFn | DFd | F | p | p<.05 | ges |
|---|---|---|---|---|---|---|
| Drug | 1 | 39 | 0.007 | 9.33e-01 | 0.000115 | |
| variable | 1 | 39 | 22.666 | 2.66e-05 | * | 0.178000 |
| Drug:variable | 1 | 39 | 0.498 | 4.85e-01 | 0.005000 |
The magnitude of the change in CPA score was not different for NorBNI-treated mice (p = 0.48).