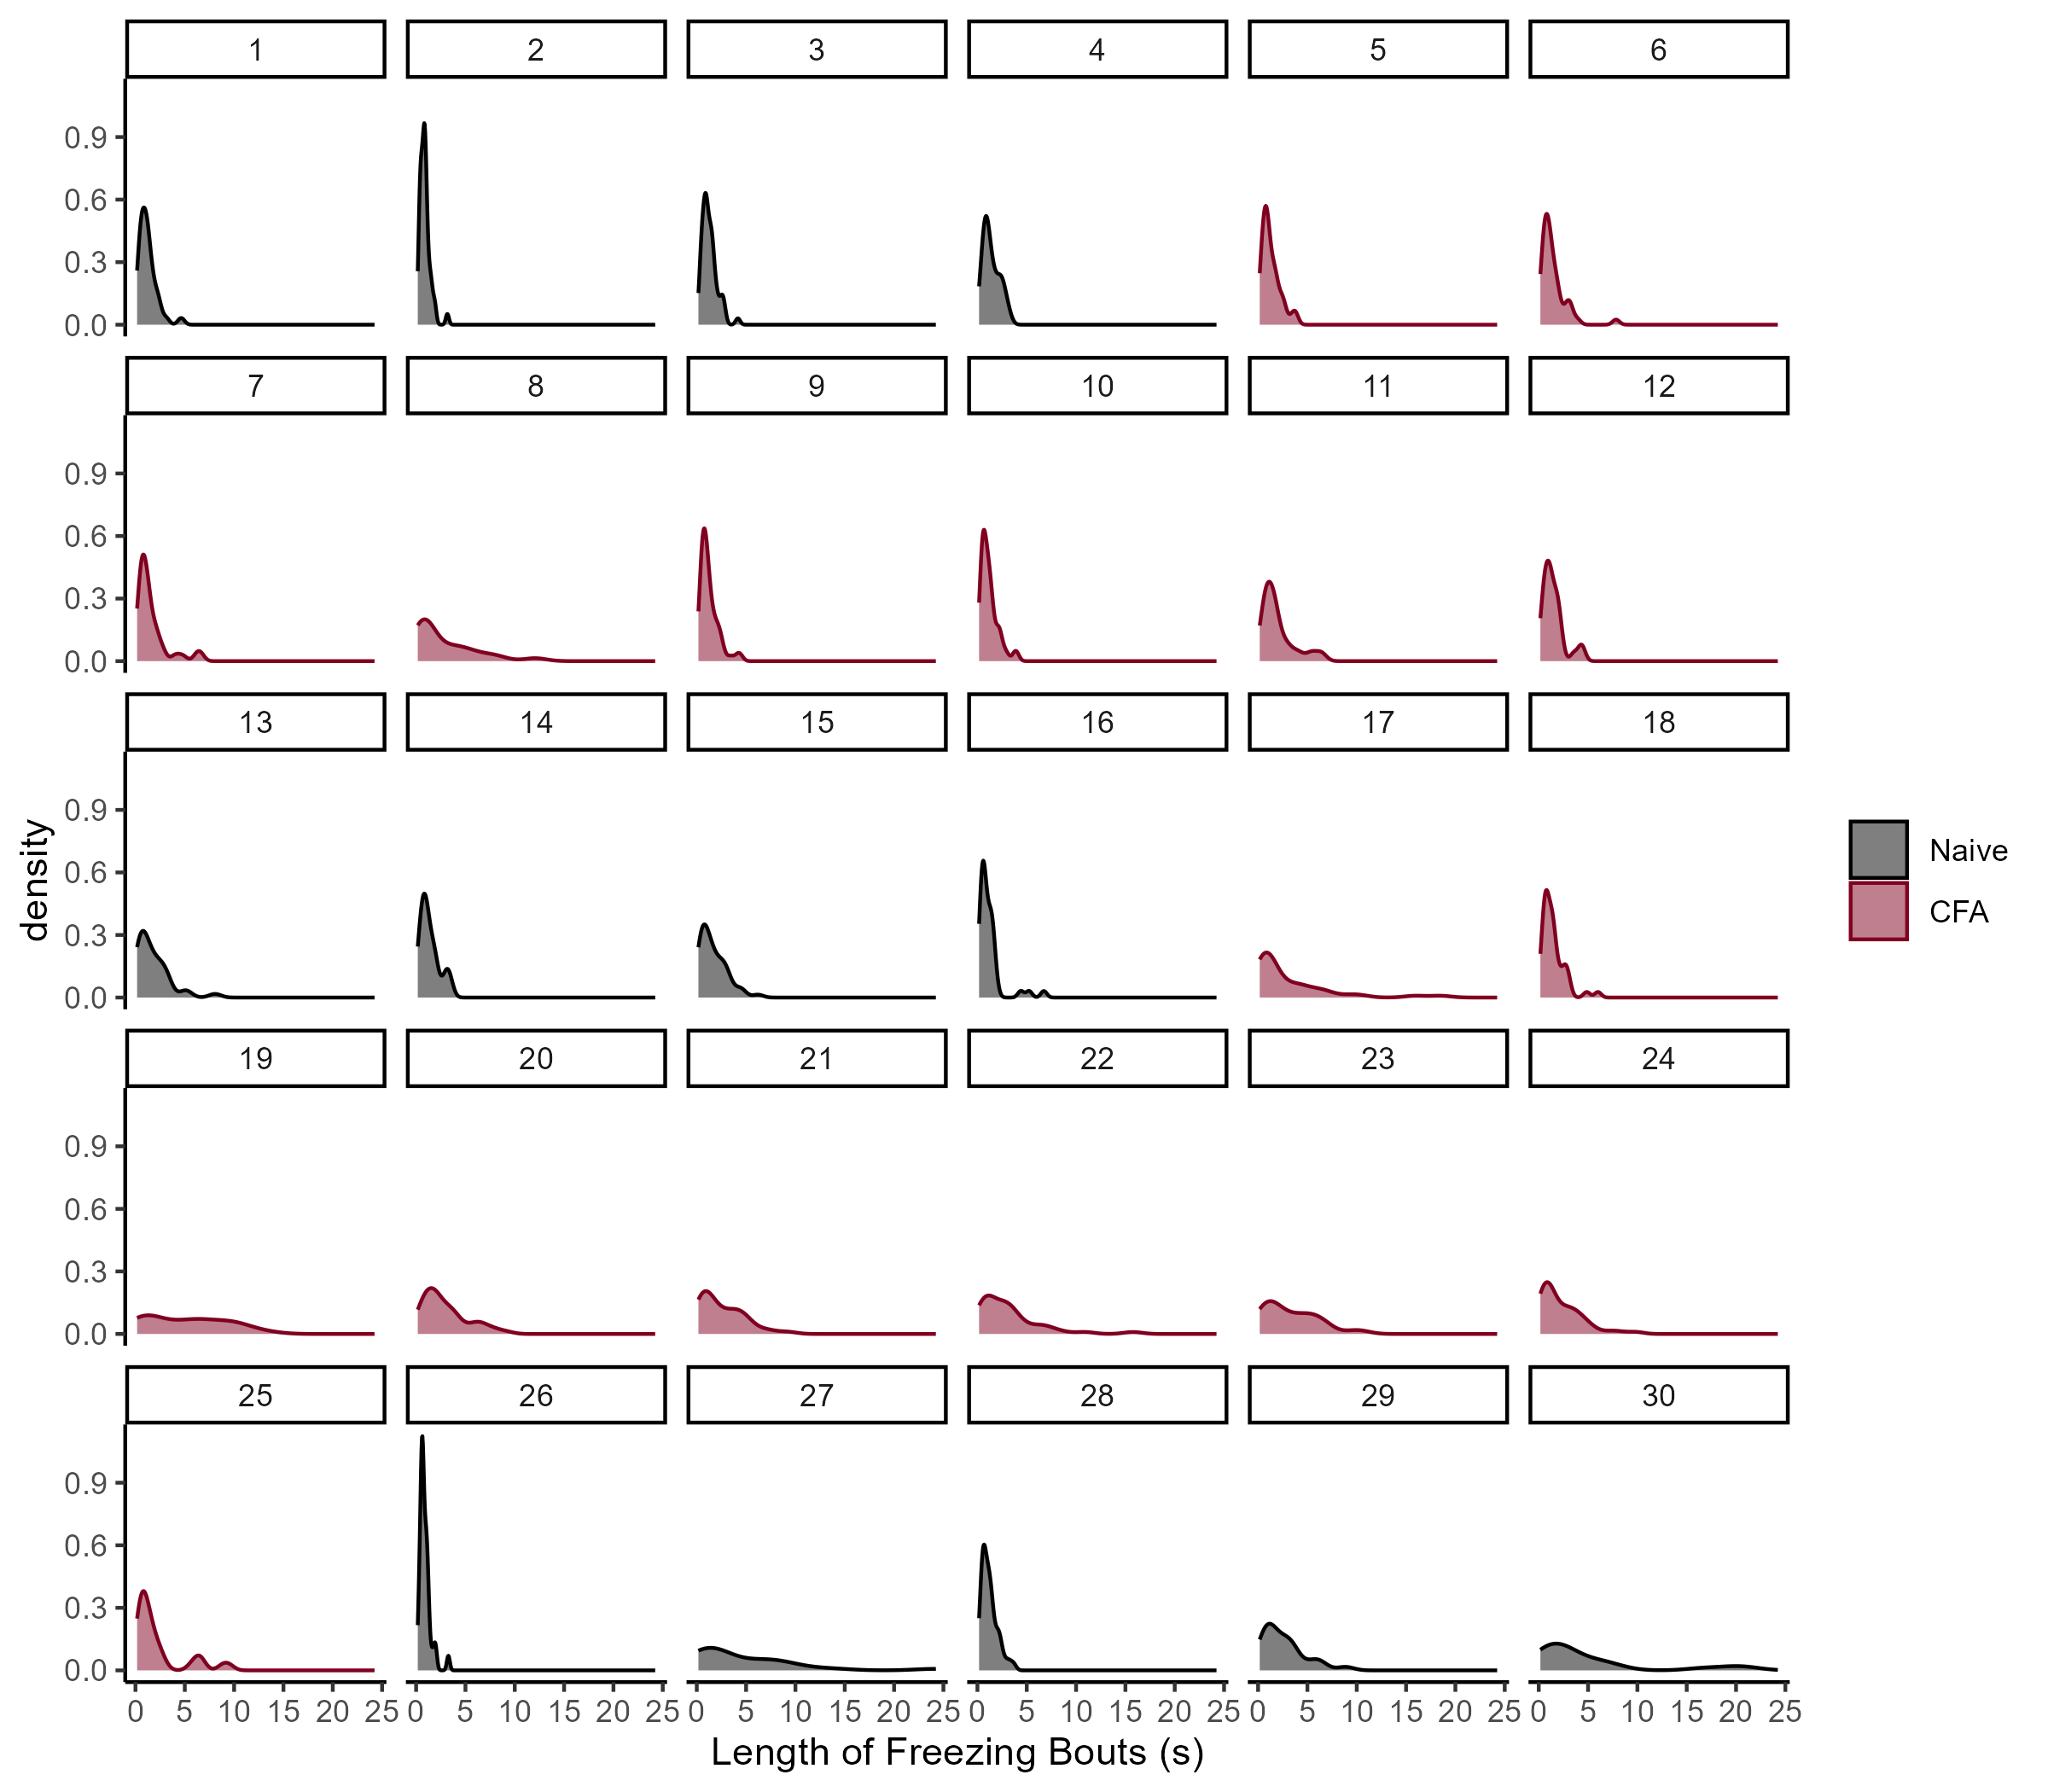
Supplemental Figure 2

Supplemental Figure 2. Distributions of the lengths of bouts of freezing during TMT for the 30 mice shown in Figure 1 of the main text. For every individual, the distributions of freezing episodes are right-skewed, indicating that mice exhibit many shorter bouts of freezing along with fewer longer episodes.
library(moments)
skew_df <- a %>%
  group_by(ID) %>%
  summarise(
    skew = skewness(Duration)
  )

t.test(skew_df$skew, mu = 0, alternative = "greater")
##
## One Sample t-test
##
## data: skew_df$skew
## t = 14.66, df = 29, p-value = 3.031e-15
## alternative hypothesis: true mean is greater than 0
## 95 percent confidence interval:
## 1.379179 Inf
## sample estimates:
## mean of x
## 1.559989The distributions of bout durations of freezing responses are heavily right-skewed during TMT presentation (t29 = 14.66, p < 0.001). For this reason, aggregating the behavior by calculating the mean length of freeze for each mouse would not be statistically appropriate. Instead, we aggregated all the freezing episodes for each condition, and compared the resultant distributions between groups in our analyses.