Figure 1 - Homecage Behaviors after CFA in male mice
Published Image
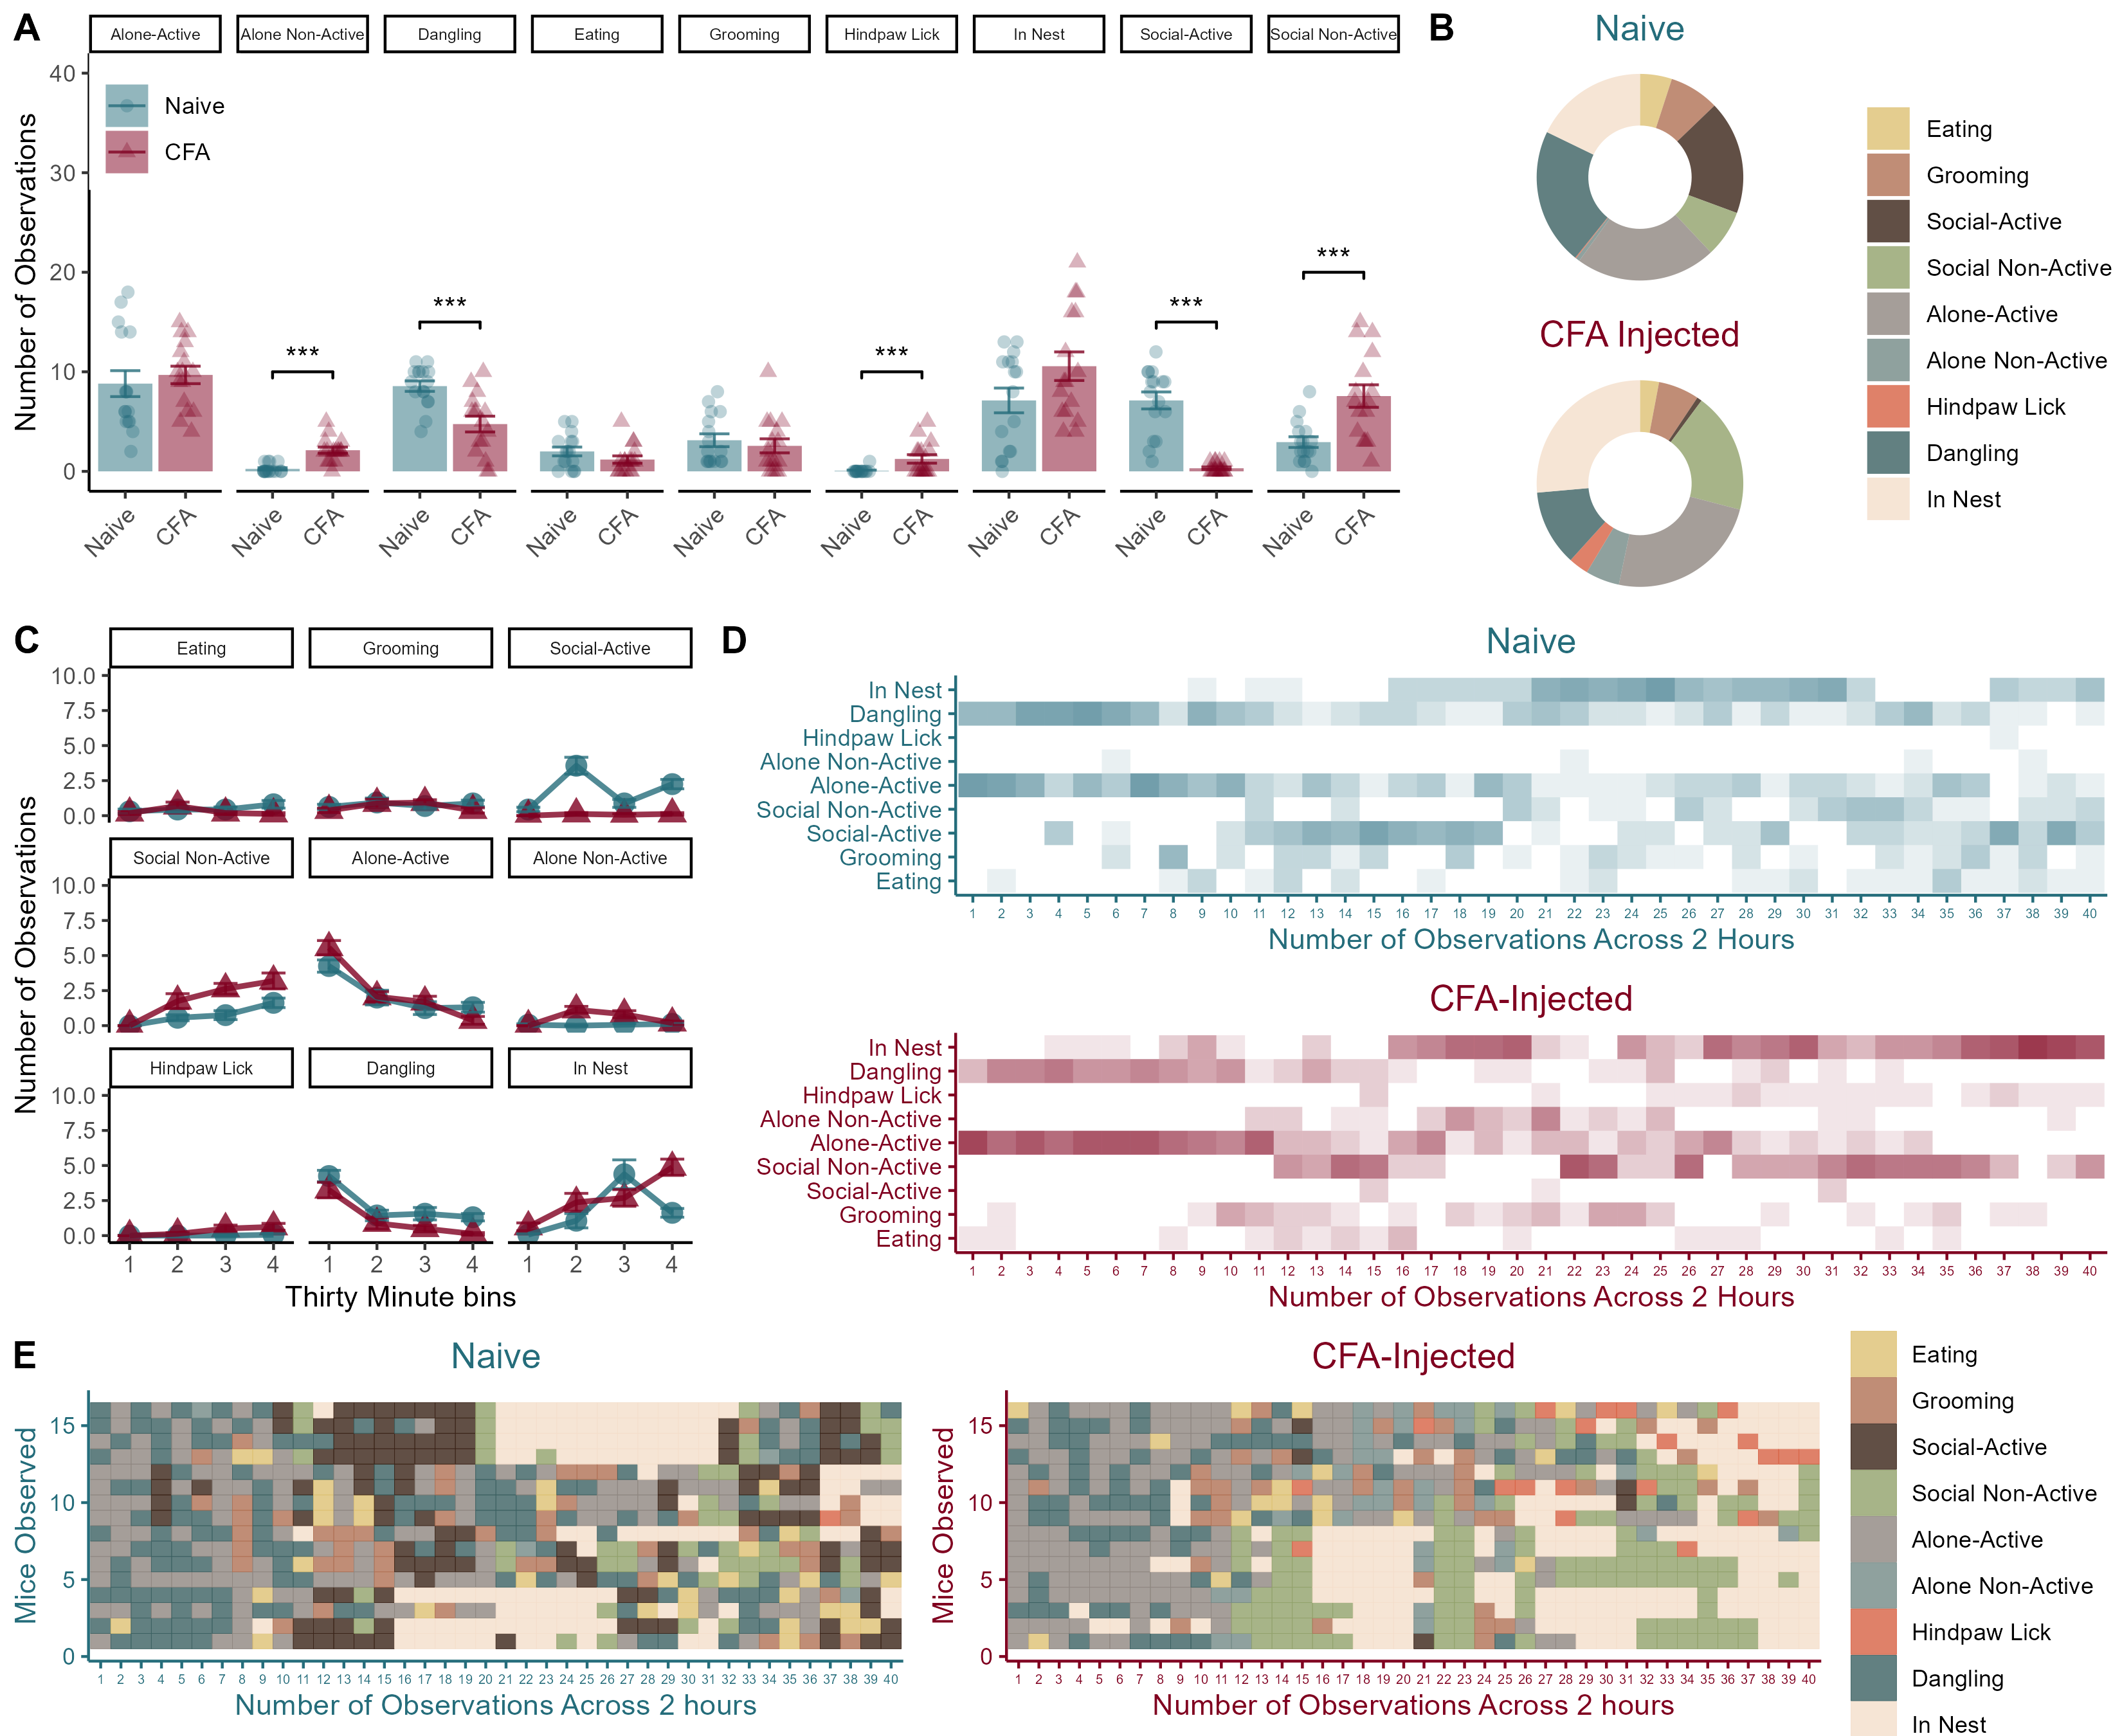
Figure 1. Homecage behaviors in male mice after an injection of 10\(\mu l\) of 50% CFA. (A) Total number of observations of each behavior category across the two-hour observation period. (B) Donut charts showing the breakdown of average time spent engaging in each behavior for each group. (C) Line charts showcase group differences in changes in behavior across the two-hour long session. (D and E) are qualitative representations of the distribution of behaviors observed across the 40 time points. Data represented as mean value +/- SEM. \(***\) indicates p < 0.001.
Statistical Analyses
Overall MANOVA for HC Behavs for males
# All behaviours in the model throws an error - it knows that you need to leave one out I suppose.

# It is important to leave one behavior out of the MANOVA to allow for a degree of freedom in the analysis.

## I thought originally that I would leave time in the nest out, but bc there is a clear sex difference in that behaviour I chose eating instead here:

fit <- manova(cbind(Grooming,`Social-Active`,`Social Non-Active`,`Alone-Active`,`Alone Non-Active`,`Hindpaw Lick`,`Dangling`,`In Nest`) ~ Condition, data=b)
summary(fit)
## Df Pillai approx F num Df den Df Pr(>F)
## Condition 1 0.536 17.183 8 119 < 0.00000000000000022 ***
## Residuals 126
## ---
## Signif. codes: 0 '***' 0.001 '**' 0.01 '*' 0.05 '.' 0.1 ' ' 1- The overall MANOVA for males was significant (F(1,30) = 43.46, p < 0.001), indicating that 10 \(\mu l\) of 50% CFA altered patterns of behaviour during the two-hour interval after injection.
Follow up analyses
# Prints out the individual ANOVAs for each behaviour
summary.aov(fit)
## Response Grooming :
## Df Sum Sq Mean Sq F value Pr(>F)
## Condition 1 0.633 0.63281 0.7691 0.3822
## Residuals 126 103.672 0.82279
##
## Response Social-Active :
## Df Sum Sq Mean Sq F value Pr(>F)
## Condition 1 92.82 92.820 50.51 0.00000000007788 ***
## Residuals 126 231.55 1.838
## ---
## Signif. codes: 0 '***' 0.001 '**' 0.01 '*' 0.05 '.' 0.1 ' ' 1
##
## Response Social Non-Active :
## Df Sum Sq Mean Sq F value Pr(>F)
## Condition 1 42.78 42.781 15.729 0.0001219 ***
## Residuals 126 342.72 2.720
## ---
## Signif. codes: 0 '***' 0.001 '**' 0.01 '*' 0.05 '.' 0.1 ' ' 1
##
## Response Alone-Active :
## Df Sum Sq Mean Sq F value Pr(>F)
## Condition 1 1.53 1.5313 0.2959 0.5874
## Residuals 126 651.97 5.1744
##
## Response Alone Non-Active :
## Df Sum Sq Mean Sq F value Pr(>F)
## Condition 1 7.031 7.0312 17.83 0.00004588 ***
## Residuals 126 49.688 0.3943
## ---
## Signif. codes: 0 '***' 0.001 '**' 0.01 '*' 0.05 '.' 0.1 ' ' 1
##
## Response Hindpaw Lick :
## Df Sum Sq Mean Sq F value Pr(>F)
## Condition 1 2.820 2.82031 10.231 0.001747 **
## Residuals 126 34.734 0.27567
## ---
## Signif. codes: 0 '***' 0.001 '**' 0.01 '*' 0.05 '.' 0.1 ' ' 1
##
## Response Dangling :
## Df Sum Sq Mean Sq F value Pr(>F)
## Condition 1 29.07 29.0703 8.3725 0.00449 **
## Residuals 126 437.48 3.4721
## ---
## Signif. codes: 0 '***' 0.001 '**' 0.01 '*' 0.05 '.' 0.1 ' ' 1
##
## Response In Nest :
## Df Sum Sq Mean Sq F value Pr(>F)
## Condition 1 23.63 23.6328 3.332 0.07031 .
## Residuals 126 893.67 7.0926
## ---
## Signif. codes: 0 '***' 0.001 '**' 0.01 '*' 0.05 '.' 0.1 ' ' 1- Male mice that were injected with CFA exhibited fewer socially-active behaviours (F(1,30) = 66.62, p < 0.001),
- More socially inactive behaviours (F(1,30) = 14.55, p < 0.001),
- More hindpaw licks (F(1,30) = 8.07, p = 0.008),
- And less time dangling (F(1,30) = 17.19, p < 0.001).
Note that the non-statistically significant results shown above are not reported in the mauscript.